
Some equations and variables in this section are expressed in English units only due to their source.
Density (γd or γdry)
Typical densities for commonly encountered dry soils. Ice rich soils can have substantially smaller dry densities.
Table 1: Typical Soil Densities
| Soil | γd (lb/ft3) |
|---|---|
| Gravel and sand | 120 – 140 |
| Silts and clays | 90 – 100 |
| Peat | ˜ 20 |
Normally, dry densities are used in most calculations (gd); however, the total density of a soil (including moisture) can be calculated as follows:
For example, if a gravel has γd = 130 lb/ft3 and w = 5%, then γt = 130(1 + 5/100) = 136.5 lb/ft3
Moisture Content (w)
Soil moisture content can be calculated as follows:


Table 2: Typical Moisture Contents of Non-Ice Rich Soils
| Material | γd (lb/ft3) |
|---|---|
| Gravel | 2 – 10 |
| Sands | 5 – 15 |
| Silts | 5 – 40 |
| Clays | 10 – 50 or more |
| Organic (Peat) | > 50 |
Thermal Conductivity (k)
The thermal conductivity is the rate of heat flow through a unit area under a thermal gradient (recall that 1 BTU is the energy (heat) required to raise the temperature of 1 lb of water 1 °F):
Units: BTU/hr • ft2 • °F/ft or BTU/hr • ft • °FFurther, ksnow (loose) = 0.06, ksnow (compact) = 0.20.
In the range of water contents (5 to 10%) and dry densities (125-135 lb/ft3) commonly encountered in embankments and pavement base courses, thermal conductivity is very sensitive to moisture content and soil type. Soil thermal conductivities can be obtained from Figures 1 through 3 (from Kersten, 1949[1] and Air Force, 1966[2]):
For example, using Figures 1 through 3:
Base Course (granular)
γd = 135 lb/ft3
w = 5%
kfrozen = 1.8 BTU/hr • ft2 • °F
kunfrozen = 1.65 BTU/hr • ft2 • °F
Subgrade (silt)
γd = 100 lb/ft3
w = 15%
kfrozen = 0.8 BTU/hr • ft2 • °F
kunfrozen= 0.72 BTU/hr • ft2 • °F
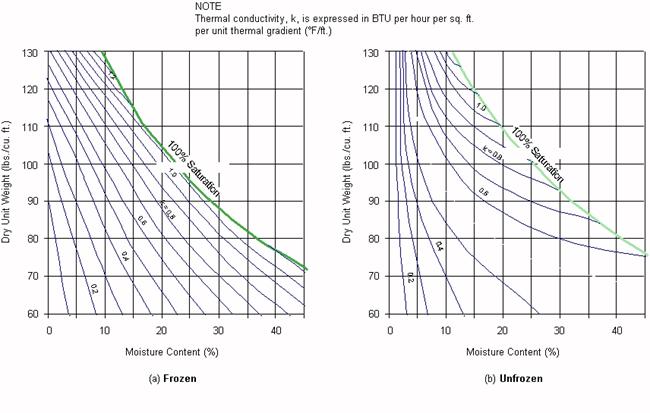

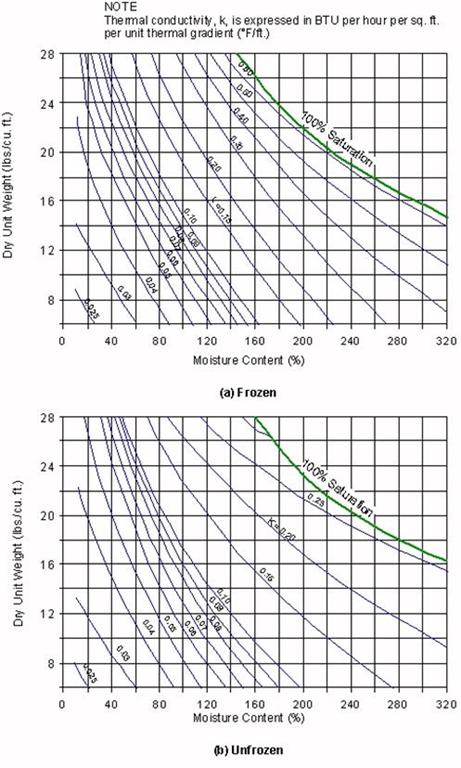
The equations used to develop Figures 1 and 2 follow. There are separate equations for frozen (tests conducted at -4 °C) and unfrozen (tests conducted at +4 °C) conditions.
The equations for silt–clay were based on five soils and are valid for moisture contents of seven percent or higher. The equations for granular soils were based on four soils (two sands, a sandy loam, and a gravel) and are valid for moisture contents of one percent or higher. Farouki (1986[3]) noted that Kersten’s equations do not apply to dry soils or to crushed rocks. Use of the above equations to estimate k is more accurate than use of Figures 1 and 2.
Volumetric Specific Heat (C)
The volumetric specific heat expresses the change in thermal energy in a unit volume of soil per unit change in temperature (units are in BTU/ft3 • °F).
Volumetric heat is derived from specific heat. (Recall: specific heat is the change in thermal energy per unit weight per unit change in temperature. If objects of the same weight but of different materials receive the same amount of energy (heat), they will come to equilibrium at different temperatures. Or, stated another way, how much each object’s temperature changes depends on the specific heat of the material, if the mass and energy inputs are identical).
Latent Heat (L)
All objects have energy (heat). A portion of this thermal energy (stored heat) is released when the object cools. The sketch below represents a volume of soil with some moisture as it freezes:
As water freezes, thermal energy equal to L is released while the temperature of the soil remains nearly constant. Thus, the latent heat is the energy required to transform 1 lb of a pure substance from one phase to another at constant temperature. Further, 1 lb. of water gives off 144 BTU as it freezes. The latent heat of a soil can be represented by:

An embankment material with w = 5% and gd = 140 lb/ft3,

Freezing and Thawing Indexes
Depth of freezing and thawing depends in part on the magnitude and duration of the temperature differential below or above freezing (32 °F) at the ground surface. The freezing or thawing index is therefore given by the summation of the degree-days for a freezing or thawing season.
Calculations for Freezing Index (FI) or Thawing Index (TI)
Example FI/TI Calculations
| Day | Maximum | Minimum | Average | Cumulative Degree Days |
|---|---|---|---|---|
| 1 | 29 | 1 | 15 | -17 |
| 2 | 9 | -11 | -1 | -33 |
| 3 | 10 | -8 | 1 | -31 |
| 4 | 15 | -1 | 7 | -25 |
| 5 | 30 | 16 | 23 | -9 |
| 6 | 38 | 30 | 34 | +2 |
| 7 | 30 | 18 | 24 | -8 |
Notes:
- Assume Day 1 start of freezing season. The negative sign in this case indicates freezing degree-days (normally omitted).
- For the purpose of assessing spring load restrictions, use 29 °F in lieu of 32 °F. This accounts for the “dark” bituminous surface
Air and Surface Indexes
Normally, data are only available for air freezing and thawing indexes (@ 1 meter in air above ground). However there is still a need to establish potential heat flow at the air-ground interface. No simple correlation exists between air and surface indexes. Differences between air and surface temperatures are influenced by:
- latitude
- cloud cover
- time of year
- wind speed
- surface characteristics
- subsurface thermal properties
- surface slope and orientation
However, designers generally use “n-factor” for purposes of correlation.
n-Factor for Freezing Conditions
“n” increases with increases in latitude and wind speed. Snow covered surfaces reflect large portion of incoming solar radiation with a resulting larger surface freezing index.
![]()
Table 3. Typical “n” Values for Freezing Conditions
| Surface Type | “n” |
|---|---|
| Snow | 1.0 |
| Pavements free of snow and ice | 0.9 |
| Sand and gravel | 0.9 |
| Turf | 0.5 |
n-Factor for Thawing Conditions
“n” decreases with increases in latitude and wind speed.
![]()
Table 5. Typical “n” Values for Thawing Conditions
| Surface Type | “n” |
|---|---|
| Sand and gravel | 2.0 |
| Turf | 1.0 |
Design Freezing and Thawing Indexes
For design purposes, generally use freezing (or thawing) index based on three coldest winters (or warmest summers) in last 30 years of record. If not available, use air-freezing index for the coldest winter in last 10 years.
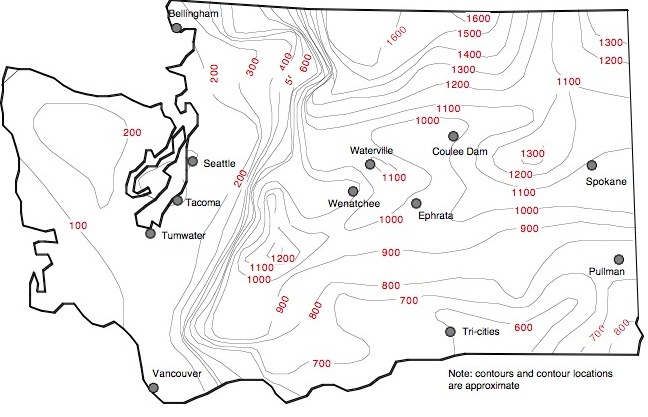
Washington State Climate Data
Figure 4 and Table 6 provide an overview of Washington State mean FI data (summarized for 1951 to 1980). Figure 5 is a contour map of Washington for desig FI data. The FI contours for both Figures 4 and 5 are only approximate. FIs should be obtained at specific sites (projects) if possible.
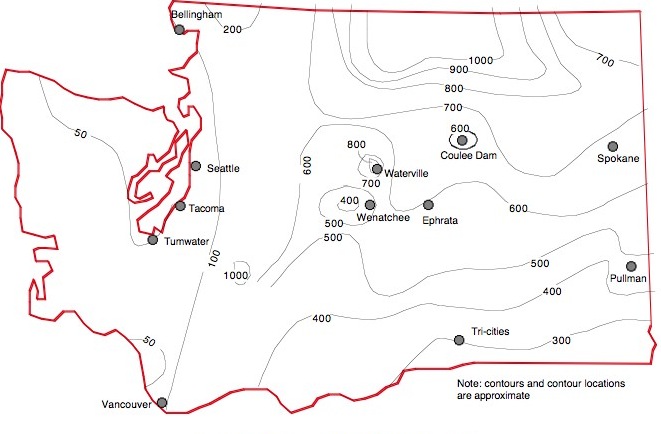
Table 6. Listing of Mean Freezing Indices for Various State of Washington Locations (based on temperature data from 1951 through 1980)
| Station | Mean Annual Freezing Index (°F-day) | Mean Annual Freezing Index (°F-days) | |||||||||||
| Jan | Feb | Mar | Apr | May | Jun | Jul | Aug | Sep | Oct | Nov | Dec | ||
| Aberdeen | 18 | 0 | 0 | 0 | 0 | 0 | 0 | 0 | 0 | 0 | 0 | 6 | 24 |
| Anacortes | 30 | 0 | 0 | 0 | 0 | 0 | 0 | 0 | 0 | 0 | 0 | 7 | 37 |
| Battle Ground | 45 | 0 | 0 | 0 | 0 | 0 | 0 | 0 | 0 | 0 | 0 | 8 | 53 |
| Bellingham | 59 | 6 | 0 | 0 | 0 | 0 | 0 | 0 | 0 | 0 | 0 | 18 | 83 |
| Bellingham Airport | 67 | 7 | 0 | 0 | 0 | 0 | 0 | 0 | 0 | 0 | 0 | 23 | 97 |
| Bickleton | 231 | 68 | 18 | 7 | 0 | 0 | 0 | 0 | 0 | 0 | 0 | 42 | 120 |
| Blaine | 68 | 7 | 0 | 0 | 0 | 0 | 0 | 0 | 0 | 0 | 0 | 25 | 100 |
| Bremerton | 20 | 0 | 0 | 0 | 0 | 0 | 0 | 0 | 0 | 0 | 0 | 8 | 28 |
| Buckly | 40 | 8 | 0 | 0 | 0 | 0 | 0 | 0 | 0 | 0 | 0 | 17 | 65 |
| Cedar Lake | 85 | 26 | 10 | 0 | 0 | 0 | 0 | 0 | 0 | 0 | 9 | 140 | 70 |
| Centralia | 29 | 0 | 0 | 0 | 0 | 0 | 0 | 0 | 0 | 0 | 0 | 8 | 37 |
| Chelan | 262 | 110 | 10 | 0 | 0 | 0 | 0 | 0 | 0 | 0 | 29 | 149 | 560 |
| Chewelah | 339 | 150 | 35 | 0 | 0 | 0 | 0 | 0 | 0 | 0 | 62 | 216 | 802 |
| Chief Joseph Dam | 293 | 136 | 17 | 0 | 0 | 0 | 0 | 0 | 0 | 0 | 34 | 175 | 655 |
| Clearbrook | 103 | 13 | 0 | 0 | 0 | 0 | 0 | 0 | 0 | 0 | 6 | 39 | 161 |
| Station | Mean Annual Freezing Index (°F-day) | Mean Annual Freezing Index (°F-days) | |||||||||||
| Jan | Feb | Mar | Apr | May | Jun | Jul | Aug | Sep | Oct | Nov | Dec | ||
| Clearwater | 22 | 0 | 0 | 0 | 0 | 0 | 0 | 0 | 0 | 0 | 0 | 6 | 28 |
| Cle Elum | 268 | 94 | 22 | 0 | 0 | 0 | 0 | 0 | 0 | 0 | 48 | 151 | 583 |
| Colfax | 226 | 45 | 9 | 0 | 0 | 0 | 0 | 0 | 0 | 0 | 29 | 99 | 408 |
| Colville | 321 | 119 | 29 | 0 | 0 | 0 | 0 | 0 | 0 | 0 | 75 | 221 | 765 |
| Concrete | 57 | 9 | 0 | 0 | 0 | 0 | 0 | 0 | 0 | 0 | 0 | 18 | 84 |
| Coulee Dam | 284 | 107 | 14 | 0 | 0 | 0 | 0 | 0 | 0 | 0 | 35 | 155 | 595 |
| Coupeville | 28 | 0 | 0 | 0 | 0 | 0 | 0 | 0 | 0 | 0 | 0 | 11 | 39 |
| Dallesport Airport | 179 | 14 | 0 | 0 | 0 | 0 | 0 | 0 | 0 | 0 | 8 | 52 | 253 |
| Davenport | 315 | 133 | 25 | 0 | 0 | 0 | 0 | 0 | 0 | 0 | 66 | 198 | 737 |
| Dayton | 206 | 30 | 0 | 0 | 0 | 0 | 0 | 0 | 0 | 0 | 18 | 61 | 315 |
| Diablo Dam | 126 | 23 | 9 | 0 | 0 | 0 | 0 | 0 | 0 | 0 | 10 | 54 | 222 |
| Electron Headworks | 78 | 20 | 8 | 0 | 0 | 0 | 0 | 0 | 0 | 0 | 8 | 40 | 154 |
| Elma | 22 | 0 | 0 | 0 | 0 | 0 | 0 | 0 | 0 | 0 | 0 | 7 | 29 |
| Elwha Rngr Station | 47 | 6 | 0 | 0 | 0 | 0 | 0 | 0 | 0 | 0 | 0 | 14 | 67 |
| Ephrata Airport | 285 | 98 | 5 | 0 | 0 | 0 | 0 | 0 | 0 | 0 | 41 | 167 | 596 |
| Station | Mean Annual Freezing Index (°F-day) | Mean Annual Freezing Index (°F-days) | |||||||||||
| Jan | Feb | Mar | Apr | May | Jun | Jul | Aug | Sep | Oct | Nov | Dec | ||
| Everett | 35 | 0 | 0 | 0 | 0 | 0 | 0 | 0 | 0 | 0 | 0 | 11 | 46 |
| Forks | 22 | 5 | 0 | 0 | 0 | 0 | 0 | 0 | 0 | 0 | 0 | 10 | 37 |
| Glenoma | 47 | 9 | 0 | 0 | 0 | 0 | 0 | 0 | 0 | 0 | 0 | 17 | 73 |
| Grapeview | 17 | 0 | 0 | 0 | 0 | 0 | 0 | 0 | 0 | 0 | 0 | 7 | 24 |
| Hatton | 266 | 54 | 0 | 0 | 0 | 0 | 0 | 0 | 0 | 0 | 43 | 124 | 487 |
| Hoquiam | 15 | 0 | 0 | 0 | 0 | 0 | 0 | 0 | 0 | 0 | 0 | 9 | 24 |
| Kennewick | 202 | 26 | 0 | 0 | 0 | 0 | 0 | 0 | 0 | 0 | 18 | 54 | 300 |
| Kent | 28 | 0 | 0 | 0 | 0 | 0 | 0 | 0 | 0 | 0 | 0 | 8 | 36 |
| Kid Valley | 43 | 8 | 0 | 0 | 0 | 0 | 0 | 0 | 0 | 0 | 0 | 16 | 67 |
| Lacrosse | 248 | 42 | 0 | 0 | 0 | 0 | 0 | 0 | 0 | 0 | 30 | 103 | 423 |
| Landsburg | 48 | 8 | 0 | 0 | 0 | 0 | 0 | 0 | 0 | 0 | 0 | 15 | 71 |
| Laurier | 350 | 121 | 35 | 0 | 0 | 0 | 0 | 0 | 0 | 0 | 82 | 238 | 826 |
| Lind | 266 | 62 | 0 | 0 | 0 | 0 | 0 | 0 | 0 | 0 | 43 | 126 | 497 |
| Longview | 36 | 0 | 0 | 0 | 0 | 0 | 0 | 0 | 0 | 0 | 0 | 6 | 42 |
| Millin Reservoir | 42 | 6 | 0 | 0 | 0 | 0 | 0 | 0 | 0 | 0 | 0 | 13 | 61 |
| Station | Mean Annual Freezing Index (°F-day) | Mean Annual Freezing Index (°F-days) | |||||||||||
| Jan | Feb | Mar | Apr | May | Jun | Jul | Aug | Sep | Oct | Nov | Dec | ||
| Monroe | 38 | 0 | 0 | 0 | 0 | 0 | 0 | 0 | 0 | 0 | 0 | 14 | 52 |
| Moses Lake | 292 | 92 | 0 | 0 | 0 | 0 | 0 | 0 | 0 | 0 | 50 | 153 | 587 |
| Mt. Adams Rngr Sta. | 197 | 48 | 22 | 0 | 0 | 0 | 0 | 0 | 0 | 0 | 31 | 90 | 388 |
| Moxee City | 263 | 63 | 0 | 0 | 0 | 0 | 0 | 0 | 0 | 0 | 31 | 134 | 491 |
| Mud Mtn. Dam | 56 | 15 | 5 | 0 | 0 | 0 | 0 | 0 | 0 | 0 | 0 | 21 | 97 |
| Newhalem | 88 | 18 | 6 | 0 | 0 | 0 | 0 | 0 | 0 | 0 | 7 | 39 | 158 |
| Newport | 306 | 112 | 49 | 0 | 0 | 0 | 0 | 0 | 0 | 0 | 73 | 199 | 739 |
| Northport | 275 | 94 | 19 | 0 | 0 | 0 | 0 | 0 | 0 | 0 | 46 | 174 | 608 |
| Oakville | 35 | 0 | 0 | 0 | 0 | 0 | 0 | 0 | 0 | 0 | 0 | 10 | 45 |
| Odessa | 273 | 82 | 9 | 0 | 0 | 0 | 0 | 0 | 0 | 0 | 41 | 144 | 549 |
| Olga | 29 | 0 | 0 | 0 | 0 | 0 | 0 | 0 | 0 | 0 | 0 | 11 | 40 |
| Olympia | 31 | 5 | 0 | 0 | 0 | 0 | 0 | 0 | 0 | 0 | 0 | 15 | 51 |
| Omak | 344 | 175 | 28 | 0 | 0 | 0 | 0 | 0 | 0 | 0 | 67 | 234 | 848 |
| Othello | 276 | 64 | 0 | 0 | 0 | 0 | 0 | 0 | 0 | 0 | 35 | 125 | 500 |
| Palmer | 58 | 14 | 5 | 0 | 0 | 0 | 0 | 0 | 0 | 0 | 0 | 25 | 102 |
| Station | Mean Annual Freezing Index (°F-day) | Mean Annual Freezing Index (°F-days) | |||||||||||
| Jan | Feb | Mar | Apr | May | Jun | Jul | Aug | Sep | Oct | Nov | Dec | ||
| Pomeroy | 201 | 32 | 7 | 0 | 0 | 0 | 0 | 0 | 0 | 0 | 22 | 66 | 328 |
| Port Angeles | 14 | 0 | 0 | 0 | 0 | 0 | 0 | 0 | 0 | 0 | 0 | 6 | 20 |
| Prosser | 240 | 46 | 0 | 0 | 0 | 0 | 0 | 0 | 0 | 0 | 22 | 84 | 392 |
| Pullman | 243 | 77 | 0 | 0 | 0 | 0 | 0 | 0 | 0 | 0 | 38 | 118 | 476 |
| Puyallup | 30 | 0 | 0 | 0 | 0 | 0 | 0 | 0 | 0 | 0 | 0 | 11 | 41 |
| Quilcene | 39 | 5 | 0 | 0 | 0 | 0 | 0 | 0 | 0 | 0 | 0 | 14 | 58 |
| Quillayute | 22 | 5 | 0 | 0 | 0 | 0 | 0 | 0 | 0 | 0 | 0 | 9 | 36 |
| Quincy | 303 | 106 | 9 | 0 | 0 | 0 | 0 | 0 | 0 | 0 | 51 | 189 | 658 |
| Paradise | 254 | 161 | 161 | 85 | 27 | 9 | 0 | 0 | 9 | 19 | 103 | 219 | 1047 |
| Republic | 408 | 170 | 73 | 0 | 0 | 0 | 0 | 0 | 0 | 0 | 117 | 304 | 1072 |
| Richland | 199 | 28 | 0 | 0 | 0 | 0 | 0 | 0 | 0 | 0 | 13 | 54 | 294 |
| Ritzville | 281 | 94 | 10 | 0 | 0 | 0 | 0 | 0 | 0 | 0 | 42 | 143 | 570 |
| Rosalia | 269 | 94 | 22 | 0 | 0 | 0 | 0 | 0 | 0 | 0 | 49 | 142 | 576 |
| Seattle | 11 | 0 | 0 | 0 | 0 | 0 | 0 | 0 | 0 | 0 | 0 | 6 | 17 |
| Sea-Tac | 24 | 6 | 0 | 0 | 0 | 0 | 0 | 0 | 0 | 0 | 0 | 9 | 39 |
| Station | Mean Annual Freezing Index (°F-day) | Mean Annual Freezing Index (°F-days) | |||||||||||
| Jan | Feb | Mar | Apr | May | Jun | Jul | Aug | Sep | Oct | Nov | Dec | ||
| Sea U.W. | 14 | 0 | 0 | 0 | 0 | 0 | 0 | 0 | 0 | 0 | 0 | 6 | 20 |
| Sedro Wooley | 46 | 6 | 0 | 0 | 0 | 0 | 0 | 0 | 0 | 0 | 0 | 15 | 67 |
| Sequim | 20 | 0 | 0 | 0 | 0 | 0 | 0 | 0 | 0 | 0 | 0 | 8 | 28 |
| Shelton | 21 | 0 | 0 | 0 | 0 | 0 | 0 | 0 | 0 | 0 | 0 | 8 | 29 |
| Snqlm. Falls | 44 | 10 | 0 | 0 | 0 | 0 | 0 | 0 | 0 | 0 | 0 | 16 | 70 |
| Spokane | 299 | 108 | 24 | 0 | 0 | 0 | 0 | 0 | 0 | 0 | 58 | 178 | 667 |
| Sprague | 287 | 94 | 14 | 0 | 0 | 0 | 0 | 0 | 0 | 0 | 48 | 148 | 591 |
| Stampede Pass | 283 | 150 | 116 | 48 | 13 | 0 | 0 | 0 | 0 | 9 | 105 | 213 | 937 |
| Startup | 38 | 7 | 0 | 0 | 0 | 0 | 0 | 0 | 0 | 0 | 0 | 13 | 58 |
| Stehekin | 195 | 70 | 12 | 0 | 0 | 0 | 0 | 0 | 0 | 0 | 44 | 127 | 448 |
| Sunnyside | 216 | 35 | 0 | 0 | 0 | 0 | 0 | 0 | 0 | 0 | 16 | 73 | 340 |
| Tacoma City Hall | 17 | 0 | 0 | 0 | 0 | 0 | 0 | 0 | 0 | 0 | 0 | 7 | 24 |
| Vancouver | 57 | 0 | 0 | 0 | 0 | 0 | 0 | 0 | 0 | 0 | 0 | 8 | 65 |
| Walla-Walla Airport | 192 | 24 | 0 | 0 | 0 | 0 | 0 | 0 | 0 | 0 | 18 | 59 | 293 |
| Walla-Walla | 188 | 20 | 0 | 0 | 0 | 0 | 0 | 0 | 0 | 0 | 14 | 50 | 272 |
| Station | Mean Annual Freezing Index (°F-day) | Mean Annual Freezing Index (°F-days) | |||||||||||
| Jan | Feb | Mar | Apr | May | Jun | Jul | Aug | Sep | Oct | Nov | Dec | ||
| Wapato | 214 | 36 | 0 | 0 | 0 | 0 | 0 | 0 | 0 | 0 | 18 | 80 | 348 |
| Waterville | 349 | 152 | 51 | 0 | 0 | 0 | 0 | 0 | 0 | 0 | 84 | 246 | 882 |
| Wenatchee | 233 | 83 | 0 | 0 | 0 | 0 | 0 | 0 | 0 | 0 | 22 | 128 | 466 |
| Wilbur | 306 | 126 | 20 | 0 | 0 | 0 | 0 | 0 | 0 | 0 | 53 | 189 | 694 |
| Willapa Harbor | 12 | 0 | 0 | 0 | 0 | 0 | 0 | 0 | 0 | 0 | 0 | 0 | 12 |
| Wilson Creek | 276 | 79 | 6 | 0 | 0 | 0 | 0 | 0 | 0 | 0 | 42 | 163 | 566 |
| Winthrop | 451 | 206 | 65 | 0 | 0 | 0 | 0 | 0 | 0 | 0 | 108 | 342 | 1172 |
| Yakima | 258 | 63 | 0 | 0 | 0 | 0 | 0 | 0 | 0 | 0 | 31 | 123 | 475 |
Source: U.S. Department of Commerce, “Degree Days to Selected Bases,” National Climatic
Center, Federal Building, Asheville, N.C., December 1982.
Depth of Freeze – Implications for Pavement Design
One of the implications of the preceding calculations, FI contour maps, etc., is that the
total depth of the pavement structure should be influenced in some way by such results.
For example, several SHAs use the rule-of-thumb that the pavement structure should
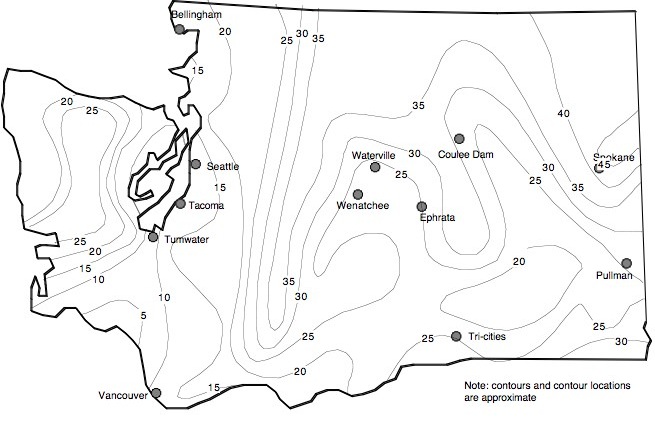
equal at least one-half of the expected depth of freeze. To this end, Figures 6 and
7 were prepared. These contour maps show the expected depths of freeze
corresponding to the design FI (refer to Figure 5) for fine-grain soil (Figure 6) and
coarse-grain soil (Figure 7). The fine-grain soil calculations assumed a γd = 100
lb/ft3 (1600 kg/m3) and water content = 20 percent. The coarse-grain soil calculations
assumed a γd = 130 lb/ft3) (2080 kg/m3)and water content = 5 percent.
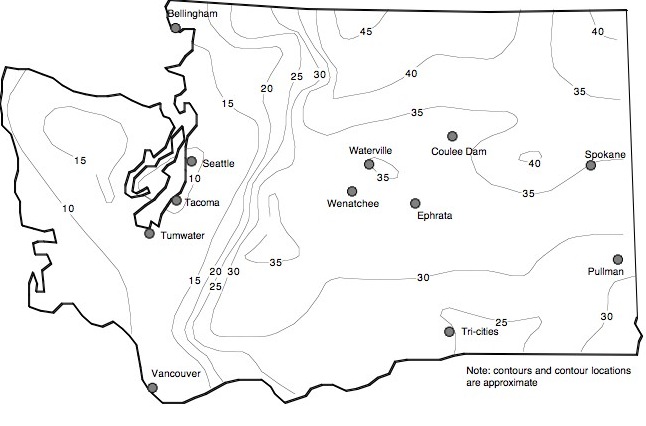
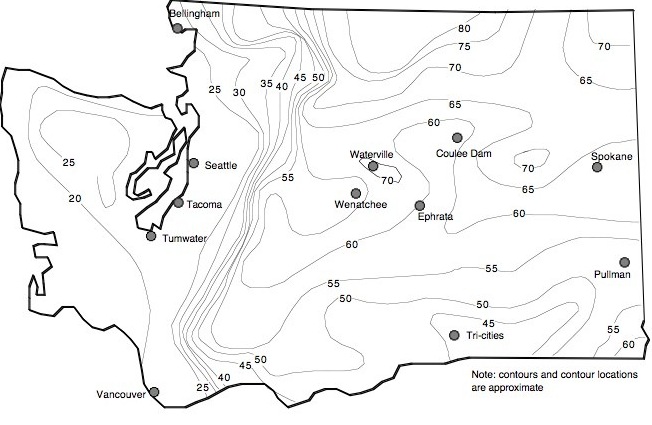
Figure 8 shows contours of measured depths of freeze as determined during the
extremely cold winters of 1949 and 1950 (letter correspondence from B. Tremper, State
Materials and Research Engineer to W.A. Bugge, Director of Highways, dated, October
17, 1951).
The freeze depths were measured in dug holes often along the edge of the
main lanes. The freeze depths were measured during February 1949 and January and
February 1950 (a total of 401 holes). Figure 8 is, in general, similar to Figure 6
(calculated freeze depths based on Design Freezing Indices and fine-grained soil) with
the exception of the Olympic Penninsula which is closer to those results shown in Figure
7 (coarse-grained soil). Some observations made by Highway Department personnel
during the winters of 1949 and 1950:
- Greatest freeze depths were observed in sandy or gravelly soils
- Snow or ice cover substantially reduced the depth of the freeze
- Frost heaving
- Most heaving observed in coastal areas (higher availability of water)
- Heaving somewhat infrequent in Eastern Washington but more severe when it did occur (again, likely related to the availability of water (or lack of))
- Maximum differential heave of 225 mm (9 in.) noted in District 2
- Silty sands showed the largest amount of ice lenses
- Specific District Comments
- District 1 (Seattle): Maximum frost depth was measured between Issaquah and North Bend 0.8 m (30 in.). On Camano Island, a 0.5 m (20 in.) frost depth was measured. Maximum differential heave was 100 mm (4 in.) (several district locations).
- District 2 (Wenatchee): Maximum depth of freeze was 0.9 m (36 in.) measured in 1949 (Wauconda Summit) and 1.3 m (51 in.) in 1950 (between Brewster and Okanogan).
- District 3 (Tumwater): Maximum depth of freeze in 1949 was 0.6 m (24 in.) and 0.4 m (17 in.) in 1950.
- District 4 (Vancouver): Maximum frost depth was 0.5 m (20 in.) in 1950.
- District 5 (Yakima): Maximum frost depth was 0.8 m (30 in.) measured in 1950 with a district-wide average of 0.6 m (24 in.) Differential heave of 150 mm (6 in.) was noted.
- District 6 (Spokane): The maximum depth of freeze was 1.1 m (43 in.) with a district average of 0.9 m (35 in.) measured in 1949. In 1950, the maximum was 1.2 m (48 in.) with a district average of 0.7 m (28 in.)
The statement about SHA frost design needs a bit of explanation. A survey conducted during 1985 [2.23] revealed the following from several “northern” states:
| Agency | Use of Frost Protection in Thickness Design |
|---|---|
| Alaska DOT | More than 50 percent but not full |
| Maine DOT | More than 50 percent but not full |
| Montana DOT | Frost protection not included in design |
| North Dakota DOT | Frost protection not included in design |
| Oregon DOT | More than 50 percent but not full |
| Washington DOT | Depth > 50 percent |
Thus, SHAs such as Alaska, Maine, Oregon, and Washington use knowledge about expected frost depths in the design process. Presumably, limiting the depth of frost into the subgrade soils limits, adequately, the potential for frost heave and thaw weakening for most projects/locations.
The above percentages (pavement structural section as a percentage of expected frost depth) are further reinforced by Japanese practice. Kono et al. [2.49] reported in 1973 that on the island of Hokkaido the pavement structure is set at 70 percent of the expected frost penetration (the pavement materials are non-frost susceptible).
Freezing and Thawing Indices – Implications for Maintenance Operations
The calculated FI and TI can be used to estimate the depth of freeze at a specific site (FI) and the resulting thaw (TI). The TI can be used to assess the need for seasonal load limits by maintenance personnel. Such measures are commonly used in District 2 during the winter and spring months. For more information on seasonal load restrictions, refer to Rutherford et al. (1985[4]) or Mahoney et al. (1986[5]).
Based on the referenced study (Rutherford et al. 1985[4], Mahoney et al. 1986[5]), the following guidelines relative to spring highway load restrictions were developed and evaluated. These guidelines were verified based on results from District 2 (Miller et al. 1989[6]). The guidelines can be divided into where, how much, when, and how long to apply load restrictions.
- Where to apply load restrictions. If pavement surface deflections are available to an agency, spring thaw deflections greater than 45 to 50 percent of summer deflections suggest a need for load restriction. Further, considerations such as depth of freezing (generally areas with air Freezing Indices of 400 °F-days or more), pavement surface thickness, moisture condition, type of subgrade, and local experience should be considered. Subgrades with Unified Soil Classifications of ML, MH, CL, and CH will result in the largest pavement weakening.
- Amount of load reduction. The minimum load reduction level should be 20 percent. Load reductions greater than 60 percent generally are not
warranted based on potential pavement damage. A load reduction range of 40 to 50 percent should accommodate a wide range of pavement conditions.
- When to apply load restrictions. Load restrictions should be applied after accumulating a Thawing Index (TI) of about 25 °F-days (based on an air temperature datum of 29 °F) and must be applied at a TI of about 50 °F-days (again based on an air temperature datum of 29 °F). Corresponding TI levels are less for thin pavements (e.g., two inches of asphalt concrete and six inches of aggregate base or less) in that the should TI level is 10 °F-days and the must TI level is 40 °F-days.
- When to remove load restrictions. Two approaches are recommended, both of which are based on air temperatures. The duration of the load restriction period can be directly estimated by the following relationship which is a function of Freezing Index (FI):
Duration (days) = 25 + 0.01 (FI)
Further, the duration can be estimated by use of TI and the following relationship:
TI ~– 0.3 (FI)
- Thermal Properties of Soils. Engineering Experiment Station, Bulletin 28, University of Minnesota. Minneapolis, MN.↵
- Calculation Methods for Determination of Depths of Freeze and Thaw Soils — Emergency Construction. Department of the Air Force, Manual AFM 88-40, Chapter 46, Washington, D.C.↵
- Thermal Properties of Soils. Trans Tech Publications. Clausthal-Zellerfeld, Germany.↵
- Guidelines for Spring Highway Use Restrictions, Research Report WA-RD 80.1 (FHWA-RD-86-501), Washington State Department of Transportation, Olympia, Washington, August 1985.↵
- Research Summary Report — Guidelines for Spring Highway Use Restrictions, Research Report WA-RD 80.2, Washington State Department of Transportation, Olympia, Washington, June 1986.↵
- Implementation of Guidelines on When to Apply Seasonal Load Restrictions, Proceedings, 40th Annual Road Builders’ Clinic, Washington State University, March 1989.↵