Construction Noise
Reviewed by licensed engineers
Checked against its sources by licensed professional engineers on the previous site, where reviewers weren’t recorded by name.
Noise Basics
Healthy humans can hear audible sound with a range of 20 Hz to 20,000 Hz with a maximum intensity at 3,000 Hz. (Hz = Hertz, or cycles per second.) Frequencies below 20 Hz are called “infrasound” and above 20,000 Hz “ultrasound.” The numerical magnitude of a sound typically expressed as sound pressure level in decibles, abbreviated dB.
Distance
Distance is important, since the intensity of sound decreases inversely as the square of the distance from the source.
Δ Sound Pressure Level =
Example
- r₀ = initial radius from sound source
- r₁ = second radius from sound source
and if r₁ = 2r₀ then
Adding Sounds
Typically, several sources of sound occur at the same time and is not a linear function. For example, adding one 60 dB sound to a second 60 dB sound adds to 63 dB. The formula follows:
The calculation for two 60 dB sounds is:
Energy Equivalent Sound
The Energy Equivalent Sound, or represents the same energy as the time-varying sound over the measurement period; essentially an average. Some common time scales associated with are 24 hr, 1 hr, 1 minute, one day or night.
Formula:
Where
- t₁ = start time for measurement, and
- t2 = end time for measurement.

Sound Pressure and Decibles
To avoid expressing sound or noise in terms of Pascals, Pa, the decibel scale is used. The scale uses a hearing threshold of 2.0x10⁻⁵ Pa. Sound Pressure Level (SPL) can be calculated by using the following equation:
Where
- P = the measured sound pressure level
- P₀ = the reference sound pressure, which is 20μPa or 2.0x10⁻⁵ Pa or 2.9x10⁻⁹ psi.
This gives a range of 0 to 120 dB (120 dB is the approximate threshold of pain).
Sound pressure typically ranges from 20 μPa to 20,000,000 μPa (0.0029 psi)
| Source of Sound/Noise | Approximate Sound Pressure in µPa |
|---|---|
| Launching of the Space Shuttle | 2,000,000,000 |
| Full Symphony Orchestra | 2,000,000 |
| Diesel Freight Train at High Speed at 25 m | 200,000 |
| Normal Conversation | 20,000 |
| Soft Whispering at 2 m in Library | 2,000 |
| Unoccupied Broadcast Studio | 200 |
| Softest Sound Human can Hear | 20 |
| Source: Environmental Protection Department, Government of Hong Kong. | |
Using the following table, sound pressures in dB can be qualitatively compared to other sound pressure scales.
| Source | dB |
|---|---|
| Threshold of hearing | 0 |
| Rustling leaves | 20 |
| Quiet whisper at 3 ft. | 30 |
| Quiet street | 50 |
| Inside car | 70 |
| Diesel truck | 100 |
| Jet at 100 ft. | 130 |
According to the "Fundamentals and Abatement of Highway Traffic Noise" (FHWA, 1973), a sound level change of 1 dB can barely be detected by humans, while changes of 2 to 3 dB are barely noticeable. Also,
- Change of 5 dB, readily noticeable.
- Change of 10 dB perceived as a doubling in loudness.
- Change of 20 dB represents a dramatic change.
- Change of 40 dB represents the difference between a faintly audible sound and a very load sound.
A-Weighting Scale
The way the ear responds to sound is not proportional to sound intensity but nearly proportional to the log of sound intensity - it depends on the frequency of the sound. The human ear has peak response around 2,500 to 3,000 Hz and a relatively low response at low frequencies. To account for this, sound weighting schemes have been developed, the most common being the “A-weighting” scale.
The average person perceives a change in sound level of about 10 dB as a doubling or halving the sound’s loudness. Table 3, below, shows a relationship between dBA and “noise loudness” levels.
- 70 to 80 dB: 2x as loud
- 70 to 90 dB: 4x as loud
- 70 to 100 dB: 8x as loud etc.

Source: Table 3 from a noise analysis report entitled “Tijuana River Valley Regional Park, Trails and Habitat Enhancement Project,” San Diego Dept of Public Works, Prepared by Kimley-Horn and Associates, Inc. July 2005
Sound pressure levels for the lower and upper portions of frequency are reduced before being combined into one single sound pressure level value. Designated dBA or dB(A). More weight is given to frequencies starting at 1,000 Hz.

Construction Noise Facts
Construction noise comes from equipment and activities. These include motors running, tool use, and impact, among other things. Hearing loss is common among construction workers.
Hearing loss is gradual, so it may not be noticeable until the damage is already done. The ability to hear higher pitch is lost first, while the first loss that people tend to notice is the loss of the ability to hear speech. Hearing loss is also dangerous - think about what might happen if a person can't hear someone shout or the sound of equipment behind them.
Noise can also cause tinnitis (ringing in the ears), tiredness, stress, and nervousness. Severe tinnitus can disturb the ability to sleep, and cause irritability and depression. Excessive noise raises blood pressure. Impact noises over 140 dB cause immediate nerve damage to the ear.
- Noise damages hearing based on two factors: (1) level of exposure and (2) noise intensity
- Exchange rate:(as stated by OSHA http://www.ccohs.ca/oshanswers/phys_agents/exposure_can.html) "As the sound level increases above the criterion level, Lc, the allowed exposure time must be decreased. The allowed maximum exposure time is calculated by using an exchange rate, also called a "dose-trading relation" or "trading ratio." The exchange rate is the amount by which the permitted sound level may increase if the exposure time is halved."
Noise Reduction
The Noise Reduction Rating, NRR, is a single number which is required by law to be shown on the label of each hearing protector sold in the US (40 CFR, Part 211, Subpart B, Hearing Protective Devices).

[1] Image courtesy of www.hocksproducts.com: 1) foam earplugs 2) molded earplug 3) earmuffs 4) tapered earplug
For A-weighted measurements: Protected dBA = Unprotected dBA – [NRR – 7]
Why – 7? This correction factor is used to account for the de-emphasis of low-frequency energy inherent to the A-weighting scale.
Example: Protector rated at 17 dB and used in a environment noise level of 95 dBA. The noise entering the ear would be expected to be about 95 – [17 – 7] = 85 dBA

Typical equipment and their associated NRRs:
- Ear plugs: NRR = 29

- Headset: NRR = 22

- Headset: NRR = 27

- Headset: NRR = 30

The shape of the ear can affect the way earplugs fit. Each person should choose the hearing protection that is most comfortable, because ill-fitting or uncomfortable hearing protection will not be used, and therefore would offer no protection.
Construction Equipment Noise Levels
OSHA regulations for noise exposure:
| Allowed to be unprotected | Allowed to be unprotected | |||
|---|---|---|---|---|
| Up to 8 hours | 90 decibels | |||
| Up to 4 hours | 95 decibels | |||
| Up to 1 hour | 105 decibels |
When noise reaches 95 decibels, OSHA requires you to work less than 4 hours without hearing protection. This does not mean that 95 decibels is a safe level of noise; 1 in 5 people exposed regularly to 90 decibels will lose some hearing, while short, very loud noises do the most harm.
| Equipment | Decibels | Equipment | Decibels |
|---|---|---|---|
| Pneumatic chip hammer | 103-113 | Earth Tamper | 90-96 |
| Jackhammer | 102-111 | Crane | 90-96 |
| Concrete joint cutter | 99-102 | Hammer | 87-95 |
| Portable saw | 88-102 | Earthmover | 87-94 |
| Stud welder | 101 | Front-end loader | 86-94 |
| Bulldozer | 93-96 | Backhoe | 84-93 |
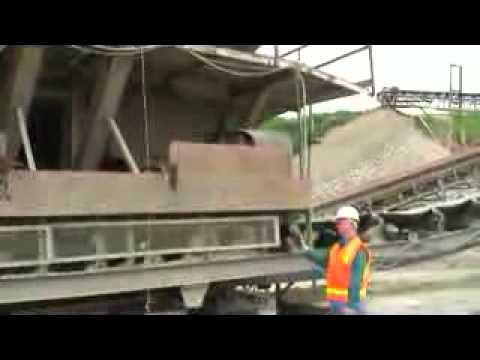
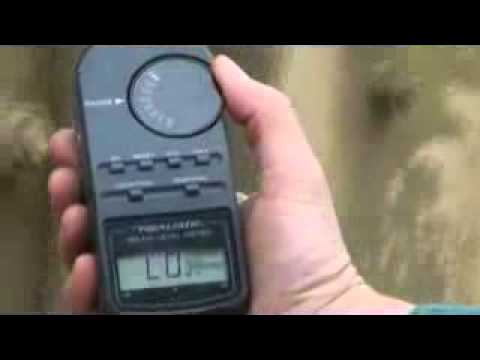
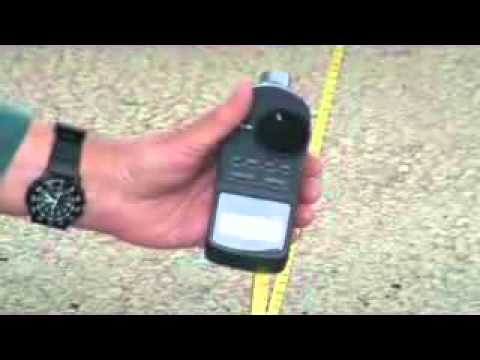
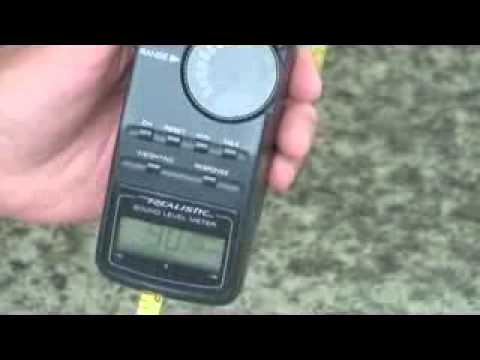
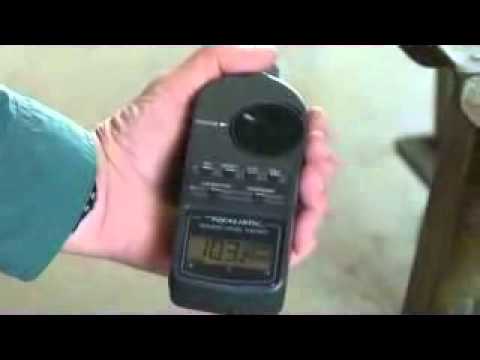
| See videos, below. | |||
A good rule of thumb is that if people 3 feet apart need to raise their voices to speak to one another, it is too noisy and hearing protection should be used.
Also try to move around the site in the course of the day, and move from more to less noisy areas as work allows. During rest or lunch breaks, move to a quieter area.
Use hearing protection regularly. This doesn't need to completely block voices or other noise, like backup alarms. Reduce the noise, don't shut it completely out.
Make a yearly appointment to have a doctor check your hearing.
Washington State Noise Limitations for Construction Workers
The Washington Industrial Safety and Health Act (WISHA) sets the Permissible Exposure Limit (PEL) at 85 dBA for a 8 hour shift, while the OSHA PEL is 90 dBA for 8 hours. According to WISHA, for every 5 dBA above 85, the exposure time is cut in ½. This is referred to as exchange rates.

WAC 296-817 Hearing Loss Prevention
According to Washington State law, the following table limits the exposure of construction workers to noise and delineates the protection required.

University of Washington
UW School of Public Health and Community Medicine has done extensive studies on construction noise, and provides brochures for most of the major construction trades.
| Category | Result (dBA) |
|---|---|
| Average full-shift noise level | 81.4 |
| Average length of work shifts | 8 hr 26 min |
| % of full-shift average levels over 85 dBA | 34% |
| % of full-shift average levels over 90 dBA | 10% |
| % of work shifts with any noise over 115 dBA | 52% |
| Average % time hearing protectors used above 85 dBA | 39% |
| Average % time hearing protectors used above 115 dBA | 34% |
| Note: Based on one minute samples of L_(eq) | |
| Trade | NRR (dBA) |
|---|---|
| Sheet metal worker | 12 |
| Insulation worker | 12 |
| Electrician | 12 |
| Tile setter | 12 |
| Carpenter | 14 |
| Cement Mason | 14 |
| Ironworker | 18 |
| Bricklayer | 22 |
| Laborer | 24 |
| Operating Engineer | 24 |
| Masonry restoration worker | 26 |
City of Seattle Construction Related Noise
| District of Sound Source | District of Receiving Property | ||
|---|---|---|---|
| Residential | Commercial | Industrial | |
| Residential | 55 | 57 | 60 |
| Commercial | 57 | 60 | 65 |
| Industrial | 60 | 65 | 70 |
| District of Sound Source | District of Receiving Property | ||
|---|---|---|---|
| Residential | Commercial | Industrial | |
| Residential | 45 | 57 | 60 |
| Commercial | 47 | 60 | 65 |
| Industrial | 50 | 65 | 70 |
City of Portland, OR Construction Related Noise
Construction times allowed by the City of Portland noise code is 7 am to 6 pm Monday through Saturday, and allows for noises up to 85 dBA at a 50 ft. distance. However, Portland recognizes that some equipment cannot meet that standard (such as jackhammers, concrete saws, etc) and are exempt from the standard during the permissible construction times.
FHWA Roadway Construction Noise Model
Based on extensive calculations and measurements from Boston’s Central Artery/Tunnel project. The data base has extensive equipment data measured via A-weighted at a distance of 50 ft. from the construction equipment. Refer to the publication: FHWA-HEP-05-054, January 2006, “FHWA Roadway Construction"
Construction Noise Links
Construction noise information:
- https://www.osha.gov/SLTC/noisehearingconservation/construction.html
- Highway Construction Noise Handbook
Safety and Health Information:
Detailed Information on Equipment Noise Levels:
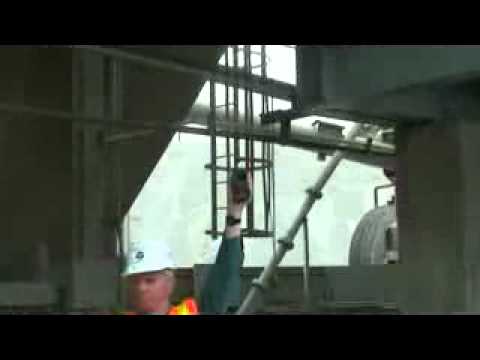
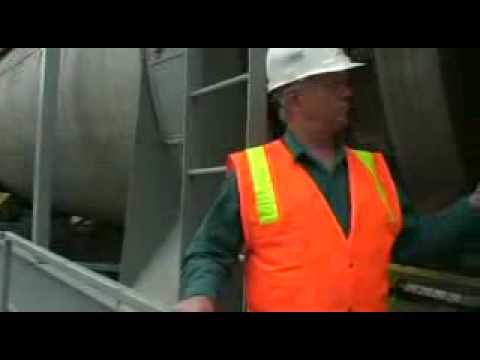
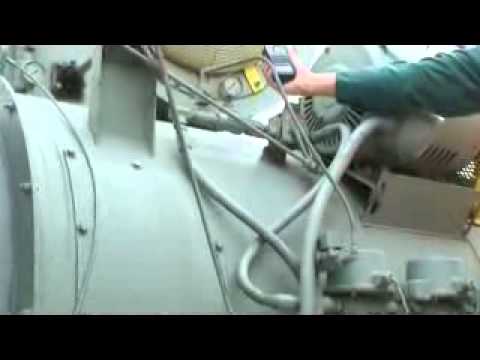
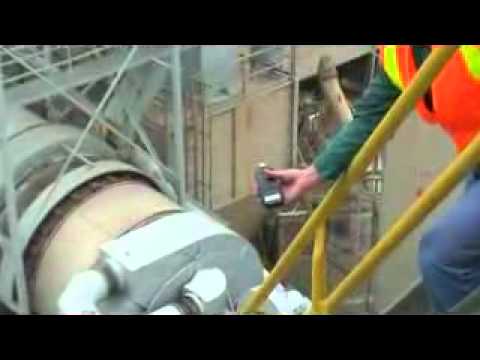
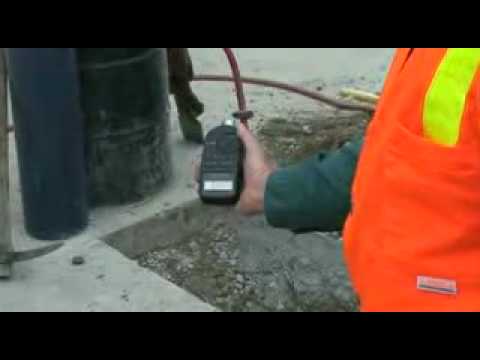
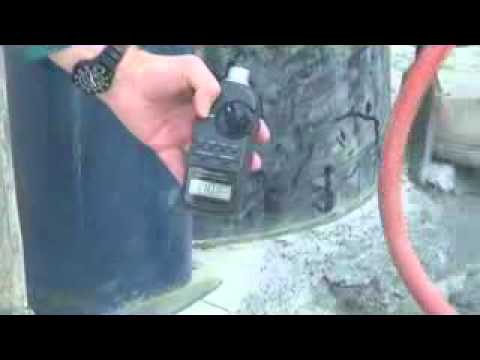
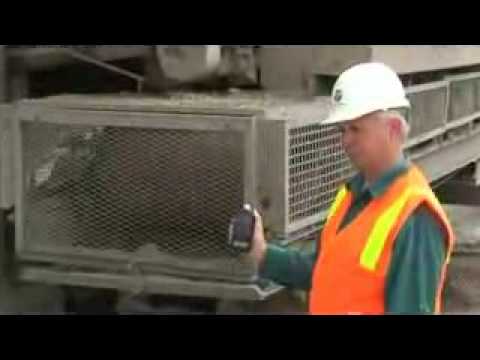
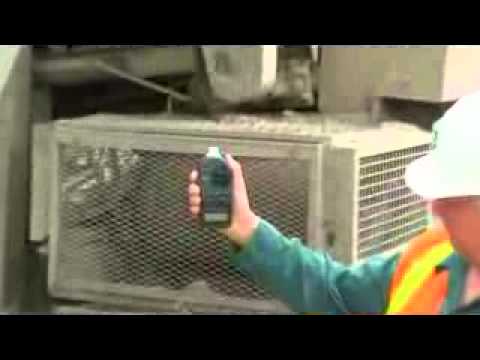
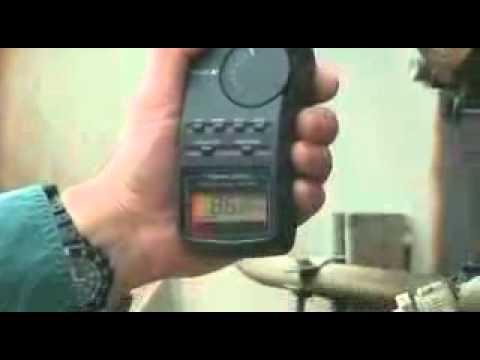
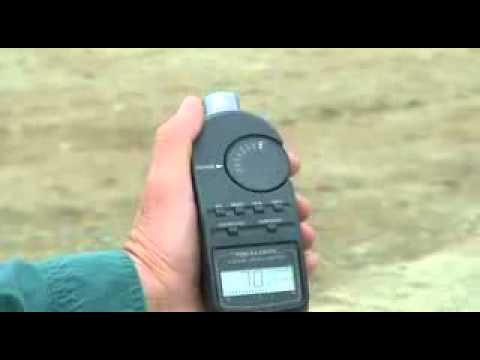
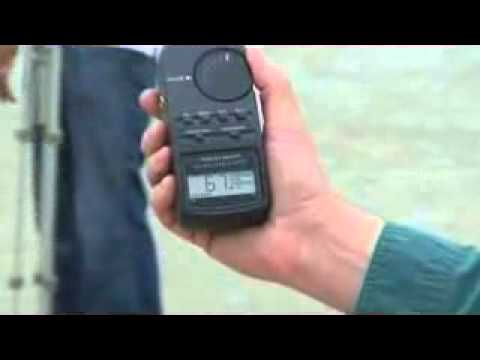
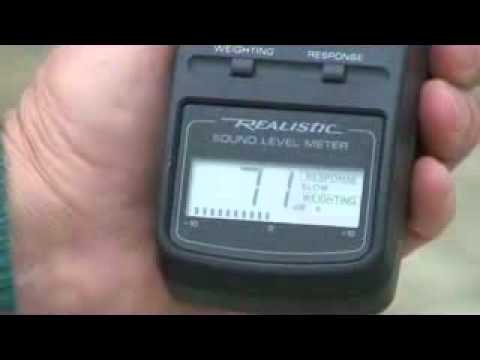
HMA Production Plant Decibel Readings

Teaching this? Figures and worked examples are free to use with credit. How to cite
Cite this page
APA
Pavement Interactive. (2018, September 10). Construction noise. HeadLight. Retrieved [the date you read it], from https://pavementinteractive.org/reference-desk/pavement-management/impacts/construction-noise/
ASCE
Pavement Interactive. (2018). “Construction Noise.” HeadLight, <https://pavementinteractive.org/reference-desk/pavement-management/impacts/construction-noise/> ([the date you read it]).
BibTeX
@misc{pavint-construction-noise,
  author = {{Pavement Interactive}},
  title = {Construction Noise},
  year = {2018},
  publisher = {HeadLight},
  howpublished = {\url{https://pavementinteractive.org/reference-desk/pavement-management/impacts/construction-noise/}},
  note = {Accessed [date]}
}