
General
I am interested in creating a comparative life cycle analysis of recycled vs. standard hot mix asphalt or HMA. In Washington State, up to 20% recycled HMA, called recycled asphalt pavement or RAP, is allowed in large-scale road construction such as state highways and interstate roadways. Researchers are looking onto using up to 100% RAP but the Washington State Department of Transportation uses much more conservative guidelines for how much RAP is acceptable at this time. The use of recycled materials in new construction is obviously beneficial from the viewpoint that the old pavement is taken out of the waste stream and is reused.
However, it is unclear whether the use of recycled pavement material is beneficial from an environmental viewpoint. Originally, it was assumed that the greatest difference between HMA and RAP would be from an energy examination. It was initially believed that RAP needed to be heated indirectly and for a longer time than virgin asphalt paving. Later data from the US EPA indicates that this assumption is incorrect, and the major differences between using HMA and RAP are in the materials recycling and diversion of large cubic volumes of waste from landfill.
I am interested in this problem because of my research with Pavement Interactive, an educational website that can be found at www.pavementinteractive.org. I have been writing articles on different pavement related issues for the past two years.
Goal
This LCA will examine the energy use and emissions of RAP versus standard asphalt pavement in Washington State. Washington State Department of Transportation, or WSDOT, recommends a maximum of 20% RAP in any major roadway project such as freeways and arterials. Energy use and climate change emissions have been chosen over other options (such as water footprint) as the relevant problems since the other benefits of using RAP are obvious (primarily in removing old asphalt pavement from the waste stream) and the important question is whether one benefit is being traded for a loss (in the case of the extra fuel use in heating the RAP to a higher temperature and for longer periods of time). Professor Cooper and her LCA class are the intended audience for this comparison study, and the results will be used in a way that may be disclosed to the public. The intended application for this LCA is to answer a question I have, to learn about LCA, and to satisfy the requirements in Professor Cooper’s class.
Scope
The core process modeled here is the production of HMA either with or without a RAP inclusion of 20%. This process will include the shipping of all materials to the asphalt plant, which under normal circumstances may or may not be on site. A variety of distances from the plant to the paver will be modeled to find an appropriate cutoff distance – where the system no longer pays off. Dump trucks will drive from the asphalt plant to the site where the asphalt paver is working. The truck beds will be filled to a certain weight with HMA. The trucks will then drive from the asphalt plant to the paving site, and the HMA will be dumped into a material transfer vehicle, an MTV. The asphalt will be mixed in the MTV in order to reduce any temperature differentials – a quality issue that will have no effect on the LCA analysis, but is an industry standard for paving jobs overseen by WSDOT. After the HMA is remixed in the MTV, the MTV transfers the HMA via conveyor belt to the asphalt paver. The asphalt paver spreads the HMA and smoothes the surface to an initial level. Finally, two or more rollers come by and compact the surface of the HMA. These may be different models of roller but for the purpose of this analysis, one model of vibratory roller will be used.
LCA methodology
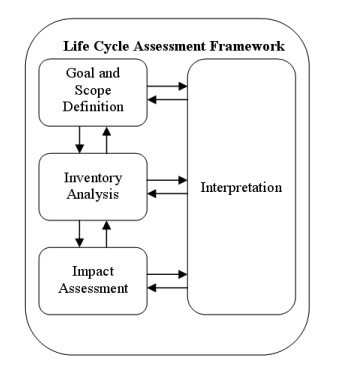
The International Organization of Standardization (ISO) wrote guidelines for life cycle assessment. Examining manufacturing and construction processes and making comparisons between material and process options has great promise for encouraging positive environmental impacts. Standardization of this process leads to greater opportunity for data sharing and adds consistency to reports from different people and organizations. These standards describe the principals and requirements for writing an LCA.
Data quality requirements
As mentioned in Professor Joyce Cooper’s LCA class slides, data quality is evaluated based on the UWME DFE lab data quality analysis method. This method is qualitative and requires the evaluation of data quality by the person writing the study, who will have to assess how data quality may affect the results of the study.
Data quality is judged on five major points:
- Time-related coverage: Deviation from the intended period: (1) Less than 6 years difference to the year of study, (2) less than 10 years difference, (3) Less than or equal to 15 years difference, (4) Age of data unknown or more than 15 years of difference.
- Geographical coverage: Deviation from the intended area: (1) Data from the area under study, (2) Average data from a larger area in which the area under study is included, (3) Data from an area under similar production conditions, (4) Data from an unknown area or area with different production conditions.
- Technology coverage: Deviation from the intended technology: (1) Data from the enterprises, processes, and materials under study, (2) Data from the processes and materials under study but from different enterprises, (3) Data on related process and materials but the same technology, (4) Data from processes and materials under study but unknown technology.
- Precision and uncertainty of the data: (1) Data include a mean value, standard deviation, uncertainty type, and a description of strengths and weaknesses (e.g. occurrence of data gaps,) (2) The mean value, standard deviation, uncertainty type, and a description of strengths and weaknesses (e.g. occurrence of data gaps) can be approximated, (4) The mean value, standard deviation, uncertainty type, and a description of strengths and weaknesses (e.g. occurrence of data gaps) are not available or were not approximated.
- Completeness and representativeness of the data: (1) Data are based on site-specific locations reporting primary data as available with the resulting percentages of locations reporting data from the potential number in existence noted, (2) Data are based on site-specific locations reporting primary data as available with no information on the resulting percentages of locations reporting data from the potential number in existence, (3) Data are estimated or calculated and have received data quality scores of 1 or 2 in the categories of Time-related coverage, Geographical coverage, and Technology coverage, (4) Data are estimated or calculated and have received data quality scores of 3 or 4 in the categories of Time-related coverage, Geographical coverage, and Technology coverage.
- Each of these points is scored from one to four, one being the highest quality data and four being the lowest. This is generally completed in tabular format being based on the categories used in the LCI.
Critical review
A critical review of this study will be performed both throughout the writing and at the final presentation of the data. Professor Joyce Cooper will assist with the continual review of data and methodology, while the ME 515 class will provide the final critical review.
Function, functional unit, and reference flows
Function and functional unit
The functional unit will be one lane mile of asphalt, which is expected to last about 10 years before needing to be resurfaced, with a functional life of 50 years before needing to be replaced. The same quality of construction will be assumed between both options. Since HMA and RAP are very similar materials from a view of the constituent materials and performance, the pavement thicknesses will be the same and the final smoothness will be within the same acceptance range between the two options. Smoothness of a pavement is typically measured by using the International Roughness Index, or IRI. This measurement was developed in the 1960s to define variation from the horizontal over a preset evaluation length, such as meters per kilometer (variation in the vertical direction in meters over a kilometer of horizontal surface.)
Reference flow
The reference flow is the amount of product necessary to satisfy the requirements of the functional unit, one lane mile of asphalt. Since HMA and RAP are nearly identical in constituent materials, the reference flow between the two systems will also be nearly identical. In general, HMA will use a greater amount of virgin asphalt and aggregate, while RAP will avoid a certain amount of material going to landfill.
System boundary
The systems examined in this LCA will comprise a macroscopic view of the road construction process and periodic maintenance. This includes the material brought to the asphalt plant or jobsite, fuel consumed in transport and machinery operation, and climate change gases emitted during the course of construction, transport, and machinery use.
It is important to note that creating an LCA is an iterative process, and the scope may change throughout the data collection phase in order to make sure the original goal is met. Inventory analysis involves data collection and calculation procedures to quantify relevant inputs and outputs of a product system. (ISO 14040, 2006[1]) This inventory analysis is prepared as outlined in ISO 14040-2006, section 5.3, and 14044-2006, section 4.3. Inventory analysis is meant to examine the material, energy and climate change gas inputs and outputs associated with the unit processes outlined in the goal and scope.

Data collection
Data was collected primarily from GREET, NONROAD, and from Craig Weiland’s similar LCA of the rehabilitation of I-5. GREET is The Greenhouse Gases, Regulated Emissions, and Energy Use in Transportation model, used for energy and air emissions data. GREET 1.7 was used for fuel, electricity and transportation data. NONROAD data was taken from Weiland’s LCA – NONROAD 2005 is a US Environmental Protection Agency model for nonroad equipment, engines and vehicles.

Unit Processes
The following processes were considered for the life cycle inventory of both HMA and RAP. Each unit process is described in detail with respect to the factors influencing both its inputs and outputs in the following paragraphs.
- sub-base grading
- heavy roller precompaction
- utility excavator work
- street sweeper
- street sweeper auxiliary engine
- bitumen production
- aggregate production
- sand production
- HMA production
- emulsifier production
- tack coat production
- tack coat transport and spraying
- natural gas for small turbine
- HMA transport via dump truck
- HMA paving
- HMA transfer via MTV
- breakdown rolling
- finish rolling
- conventional and LS diesel (at fueling station)
- diesel for nonroad engines
- natural gas – stationary tool
- natural gas – electricity generation
- residual oil at POU
- coal to power plant
- electricity at POU, Washington state
- milling
Please note that all NONROAD assumptions are based on Weiland, 2008.
Sub-base grading
A new lane-mile of pavement includes sub-base grading to prepare the site for work. A 175 horsepower grader from NONROAD was used, assuming an 8-foot wide blade coverage, and therefore two passes for one 12-foot wide lane one mile long. The grader is estimated to travel at 2 miles per hour, at 90% efficiency, and therefore the grader will be used for 1.1 hours per lane-mile.
Heavy roller precompaction
Heavy roller precompaction follows the sub-base work to compact the sub-base and make it suitable for lay-down of HMA. The roller may follow immediately behind the grader, if desired, and will compact the lane in two passes, as the drum is not 12 feet in width. The roller was modeled as a 300 horsepower roller in NONROAD, at 90% efficiency.
Utility excavator work
Utility excavator work, such as materials unloading and loading, has been considered at 4 hours of equipment use per lane mile.
Street sweeping
Street sweeping must be performed to remove debris after milling but before tack coat application and the HMA overlay occurs. The street sweeper has a 115 horsepower auxiliary engine in addition to the truck unit, and has been modeled as a medium-heavy truck in the transport section but also needed a second unit process to model the auxiliary engine. The truck is assumed to travel three passes per lane-mile, or three lane-miles per lane-mile of HMA produced. The sweeper truck is an 8-ton truck and therefore, the transport need is 24 ton-miles per lane-mile. The auxiliary engine is modeled as a 100 horsepower cement and mortar mixer, as the mixer’s rotation is comparable to the sweeper brush rotation. The sweeper travels at 10 miles per hour and has a 75% efficiency for the purposes of our evaluation. The auxiliary engine would then run for 0.4 hours per lane mile.
Bitumen production
Bitumen production is modeled based upon a European LCI by Eurobitume, published in 1999, through Weiland. The bitumen produced is grade B60 or 50/70, which is the most commonly used bitumen in Europe and a typical grade in the US.
Crushed aggregate production
The process of crushed aggregate production includes blasting of rocks with explosives, transport of the rocks with a diesel loader, and crushing in a rock crusher. The rock is crushed and then sieved to sort the rock to various gradations. Data on production of blasting materials and equipment is not included.
Sand production
Sand production includes the dewatering, excavation, transport via conveyor, screening, washing, and stockpiling of naturally occurring sand and gravel. Information on production of equipment is not considered. Sand production is included for completeness and not used, since in Washington state crushed aggregate is typically the only aggregate used. This allows the flexibility to include sand if other mix designs are considered.
HMA production
HMA production data is taken from the US EPA. HMA is produced in a drum plant and uses natural gas fired dryers, hot screens, and mixers. This is an acceptable assumption as many HMA plants use natural gas, but other types of plant could be considered by researching alternatives in US EPA Emissions Factors and AP-42, chapter 11. The mix considered in this LCI is a ½ inch Superpave mix with binder targeted at 5.4% by weight, and a profile of 13 inches, placed in five lifts. No fillers or admixtures were considered. According to the US EPA, drum counter-flow plants can process up to 50% RAP in the mix with little to no observable changes to the emissions from the plant (US EPA, 1995[2])
Emulsifier production
Emulsifier for the tack coat is produced in an emulsion plant. Emulsifier production includes the emulsification of bitumen in water with an emulsifier such as soap. Tack coat typically consists of half bitumen and half emulsifier and water.
Tack coat production
Tack coat production takes the emulsifier mentioned in the previous paragraph and mixes it with 50% bitumen and 50% water and emulsifier mixture.
Transport
On road vehicular transport data such as ‘street sweeper,’ ‘tack coat transport and spraying,’ and ‘HMA transport via dump truck’ were obtained through GREET. Medium-heavy and heavy-heavy diesel trucks were the most appropriate categories for this assessment, as medium-heavy truck can haul up to 8 tons (as in the tack coat transport and spray truck), while a heavy-heavy truck can haul up to 20 tons (as in a dump truck for HMA transport). Assumptions for both classes of truck include a full fonthaul and empty backhaul, which is appropriate considering that paving conditions are unlike most other freight conditions, and a full truck will travel to the jobsite, empty its load, and then return to the paving plant for refilling. Transport distance from the plant to the site was assumed to be 15 miles. For a 13-inch thick HMA structure, 5210 tons of HMA per lane mile are needed, which results in transport of 77,220 ton-miles of HMA. Changing the transportation modes, fronthaul/backhaul assumptions, or distances traveled could modify this assessment. RAP is assumed to come from the HMA plant, and in the RAP assessment, a 1.25 multiplier has been added to ‘HMA transport via dump truck’ to take into account the RAP traveling from various sites to the HMA plant.
Tack coat transport and spraying
A tack truck consists of two parts, a truck which is meant for hauling and a tank of tack coat with a twelve-foot wide spray bar. ‘Natural gas for small turbine’ is the model for half of the tack truck operation, while the truck part of the tack truck was already modeled in the paragraph above. The tack coat application portion of the tack truck is modeled through GREET with a small propane heater, which keeps the emulsion warm for better fluidity during application. Tack coat is required between each lift of HMA and between the sub-base and the first lift of HMA, and helps to bind the layers together. For between-layer adhesion, application of 0.06 gallons per square yard have been assumed. Tack coat is also required after milling to adhere the new HMA overlay to the old layer. More tack coat is required for this purpose, and application rates of 0.115 gallons per square yard were assumed for the resurfacing operations.
HMA paving
HMA paving is typically done in one pass, with a 12-foot wide screed, and was approximated by a 300 horsepower paver in NONROAD. In order to pave 13 inches of HMA, the paver must make 5 lifts, which means that for one lane-mile of HMA, the paver must pave 5 miles. Paving rate is estimated at about 100 tons per hour, whether for initial paving or rehabilitation.
HMA transfer via MTV
HMA transfer via MTV occurs to increase the overall quality of the HMA, whether it is virgin HMA or RAP. This is because it can be difficult to regulate the arrival of the dump trucks from the paving plant – sometimes too many trucks arrive, with more asphalt than the paver can contain in its storage hopper, while other times the paver must wait on trucks in order to continue paving. The MTV, which is required on larger paving jobs in Washington State, has a larger storage hopper and a remixer. This keeps the paver from starting and stopping as often, which increases the surface quality of the HMA as there is a noticeable seam each time the paver must halt. It also increases pavement quality through reducing the bumping and jerking from dump trucks backing up to the paver. Finally, the remixer in the MTV regulates the temperature of the HMA or RAP, which reduces areas of poor compaction due to reduced viscosity of cooler pieces of asphalt compared to the majority of the material. This can occur, for example, on the top surface of the HMA in a dump truck, as the top is exposed to air during transport. The MTV is modeled through NONROAD as a piece of 300 horsepower surfacing equipment, and travels at the same speed as the paver. Therefore the paver and MTV operating hours are the same for paving and maintenance.
Breakdown rolling
Breakdown rolling was estimated as a 300 horsepower roller through NONROAD. For a large project such as this one, two rollers are typically used at once. The rollers operate shortly behind the paver, so will operate for the same number of operating hours as the paver.
Finish rolling
Finish rolling was estimated as a 100 horsepower roller through NONROAD. One roller is needed for finish rolling, and will follow at a short delay behind the two breakdown rollers, but will operate for the same number of operating hours as the paver and two breakdown rollers.
Fuel production
The fuel production information in the unit processes of ‘conventional and low-sulfur diesel at fueling station,’ ‘diesel for nonroad engines,’ ‘natural gas as stationary fuel,’ ‘natural gas for electricity generation,’ ‘coal to power plant,’ and ‘residual oil at point of use’ are included in the inventory since many of the other unit processes use fuel and do not include the production data for those fuels. These data include the processes required from extraction through the point of use, including transportation of said fuels.
Electricity production
Electricity production, under the category of ‘electricity at point of use for Washington state’ is used by many of the unit processes which produce the materials used in HMA paving. Electricity production data was obtained from GREET via Weiland, who modified the data to represent the electricity production in Washington state, which is where the RAP guidelines for this study were obtained, and the road constructed is assumed to be located. The Washington state electricity production data is primarily dependent upon hydroelectric power generation (at 68.18%) and therefore has a very good environmental profile compared to other states.
Mill and fill
Milling and overlaying with a new surface course of HMA or RAP is needed for pavement rehabilitation, and is typically called ‘mill and fill.’ Milling and resurfacing is assumed to occur every ten years. The milling machine used is a 750 horsepower surfacing machine from NONROAD, and is assumed to take two passes to mill one lane. The mill depth will be 0.15 foot, while the overlay will be the same depth. 720 tons of waste will be produced per lane-mile, which is then trucked 15 miles for disposal. For RAP, milling is assumed to use 80% virgin HMA and 20% RAP. As technology for in-place recycling increases, up to 100% re-use of the milled-off layer is possible, and further study is recommended.
Units
Units used in calculating the life cycle inventory include the following straightforward units:
- lane miles – one mile of roadway, one lane wide (in the US, this is set at a twelve-foot standard)
- ton – a US ton
- ton-miles – typically used in freight, a ton-mile is a unit used to describe moving a ton of weight over a distance of a mile
- operating hours – used here in equipment operations, operating hours describes the amount of time for which a piece of equipment is used
- BTU – British Thermal Units, a unit for describing energy use
- gram – an SI unit of weight
Data calculation
All information associated with this inventory analysis was manipulated according to Joyce Cooper’s classroom slides and the methods outlined in The Computational Structure of Life Cycle Assessment.
Two matrices were developed, a Technology Matrix, A, and an Intervention Matrix, B. The technology matrix contains the economic flow for each of the unit processes under examination. The intervention matrix consists of the environmental flows for each of the unit processes (Hejiungs & Suh, 2002[3]). The technology matrix contains all of the quantity relationships between processes. Thus, it is possible to describe how much aggregate, diesel fuel, and etc. a certain process requires. The emissions and energy use data is located in the intervention matrix.
The demand vector, f, describes the functional unit. This describes how much of each unit process is required to meet the goal of the study. In this case, f will describe one lane-mile of pavement plus five rehabilitation processes at the end of each of the ten-year periods in the fifty year scope of the study.
Once the technology matrix, intervention matrix, and demand vector have been defined, the scaling vector, s, can be determined. The scaling vector can be calculated from A and f by multiplying A inverse by f as so:
| s = A-1 * f |
The scaling vector describes how much of each unit process is needed to meet the functional unit. The final inventory vector, g, can be calculated by multiplying the intervention matrix by the scaling vector as so:
| g = B * s |
The inventory vector describes the environmental flows found through the life cycle inventory process, and represents the aggregated environmental flows of the total system (Hejiungs & Suh, 2002[3]).
The data and results of this life cycle inventory were collected and calculated using Microsoft Excel and the formulas described in the preceding paragraphs.
f vector for HMA f vector for RAP s vector for HMA s vector for RAP 1 lane-mile of highway 1.00E+00 1.00E+00 1.00E+00 1.00E+00 sub-base grading 0.00E+00 0.00E+00 1.11E+00 1.11E+00 heavy roller precompaction 0.00E+00 0.00E+00 9.00E-01 9.00E-01 utility excavator work 0.00E+00 0.00E+00 4.00E+00 4.00E+00 street sweeper 0.00E+00 0.00E+00 1.20E-04 1.20E-04 street sweeper auxiliary engine 0.00E+00 0.00E+00 2.00E+00 2.00E+00 bitumen production 0.00E+00 0.00E+00 4.89E+02 3.94E+02 aggregate production 0.00E+00 0.00E+00 8.36E+03 6.69E+03 sand production 0.00E+00 0.00E+00 0.00E+00 0.00E+00 HMA production 0.00E+00 0.00E+00 8.82E+03 7.06E+03 emulsifier production 0.00E+00 0.00E+00 2.57E+01 2.56E+01 tack coat production 0.00E+00 0.00E+00 2.57E+01 2.56E+01 tack coat transport and spraying 0.00E+00 0.00E+00 4.46E+02 4.46E+02 natural gas for small turbine 0.00E+00 0.00E+00 5.50E-01 5.50E-01 HMA transport via dump truck 0.00E+00 0.00E+00 1.57E+05 1.85E+05 HMA paving 0.00E+00 0.00E+00 9.00E+01 9.91E+01 HMA transfer via MTV 0.00E+00 0.00E+00 9.00E+01 9.00E+01 breakdown rolling 0.00E+00 0.00E+00 1.81E+02 1.81E+02 finish rolling 0.00E+00 0.00E+00 5.50E+05 5.50E+05 conventional and LS diesel (at fueling station) 0.00E+00 0.00E+00 3.40E+02 4.01E+02 diesel for nonroad engines 0.00E+00 0.00E+00 4.18E+05 4.18E+05 natural gas – stationary tool 0.00E+00 0.00E+00 3.27E+04 2.62E+04 natural gas – electricity generation 0.00E+00 0.00E+00 9.34E+01 7.49E+01 residual oil at POU 0.00E+00 0.00E+00 4.60E+02 3.71E+02 coal to power plant 0.00E+00 0.00E+00 2.14E+02 1.71E+02 electricity at POU, Washington state 0.00E+00 0.00E+00 4.15E+02 3.33E+02 1 lane-mile of mill and fill 5.00E+00 5.00E+00 5.00E+00 5.00E+00 milling 0.00E+00 0.00E+00 2.94E+01 2.94E+01 landfill 0.00E+00 0.00E+00 0.00E+00 0.00E+00 >
HMA RAP
Total Energy BTU -5.01E+11 -5.00E+11
Fossil Fuels BTU -4.99E+11 -4.98E+11
Coal BTU -1.38E+10 -1.37E+10
Natural Gas BTU -1.66E+11 -1.39E+11
Petroleum BTU -4.54E+11 -4.54E+11
CO2 g 2.29E+10 2.28E+10
CO g 1.18E+08 1.18E+08
NOx g 1.58E+08 1.58E+08
SOx g 9.23E+06 9.14E+06
CH4 g 4.96E+07 4.83E+07
PM 2.5 g 1.71E+07 1.71E+07
PM 10 g 1.99E+07 1.99E+07
SO2 g 2.40E+06 2.25E+06
N2O g 1.10E+05 1.09E+05
Results of the HMA and RAP life cycle inventory – the higher value is highlighted as red text, while equal values have both been left in black text.
Result
As can be seen from the previous figure, it is obvious that HMA has a higher impact in fuel use and emissions overall, though the difference is not profound in most subcategories. Better data is needed for many processes related to RAP, especially including transport distances involved in using RAP as an environmental offset for HMA.
However, we can see in the following figure that including RAP appears to have a good effect on the total energy use. For each 20% increase in the amount of RAP used, the total energy in BTUs drops by a factor of 109.
Note that the total energy increases by a factor of 109 with each 20% drop in RAP percentage. This graph is formatted assuming that the contractor is using an engineered landfill as the final waste destination.
Impact Assessment
Classification helps to define which impact categories apply. In the case of this study, we have examined resource related unit processes, such as those that are nonrenewable, like fossil fuels and aggregate. Also examined were emissions related unit processes – those that emitted climate change gasses, which affect the global warming potential. Global warming potential is the ratio of the warming caused by a substance to the warming caused by a similar mass of carbon dioxide. (Cooper, 2009[4])
CO2 2.29E+10
CO 2.24E+08 using 1.9x
NOx uncertain
CH4 1.24E+09
N2O 3.28E+07
Global warming potential for HMA in equivalent kilograms of CO2
CO2 2.28E+10
CO 2.24E+08 using 1.9x
NOx uncertain
CH4 1.21E+09
N2O 3.24E+07
Global warming potential for RAP in equivalent kilograms of CO2
Characterization describes which category indicators provide an environmentally relevant, yet feasible representation of environmental impact. In GREET, the data was used to track the Total Energy, or TE, which we have seen in some of the graphs of relevant information so far.
Interpretation
Significant issues include the production of CO2 from the rolling. This has a significant effect on the climate change gas emissions. Surprisingly, the variance of one kind of landfilling versus the other two (as mentioned in the Menard article) doesn’t have any noticeable effect on the total energy or climate change emissions. There may be an error, but the process seems correct, as g = Bs, which was repeated three times for the interpretation calculations.
Other significant factual issues included completeness – this LCI is significantly complete, though for unit processes, the crushed surfacing top course was neglected and is needed for completeness. Also, varying the transport could be an interesting way to determine when the system no longer pays off, and data for average transport of RAP is needed.
Consistency was addressed well, as most of the data is from modeling (as in NONROAD, the data which was taken from Weiland, 2008[5]) and localized to Washington State. Unfortunately, the only data for important unit processes, like any of the ones that required asphalt and tack coat, were localized to Europe. Better data for at least the United States is needed.
The data quality could be significantly better. In the data quality scoring mentioned above, some of the data is very old (1990’s and early 2000’s) which would give it a score of 4, or worst. As mentioned in the previous paragraph, the geographic specificity for the oil-refining-related unit processes would also get a score of 4. If more time were available for research, it would be very useful to find better data for the Americas and much more recent data is needed.
Recommendations
In the interests of time and lack of data, certain unit processes were left out or reduced in scope. The following list includes some recommendations for further study.
• Expand the LCA to include the use of crushed surfacing top course, a structural layer of gravel beneath the HMA or RAP.
• Vary the amount of materials transport, currently 15 miles, a reasonable middle value, to see where the system no longer ‘pays off.’
• Some mix designs with RAP recommend using a softer binder to offset the loss of viscosity in older asphalt binders. This LCA neglects the use of any binder but one well-accepted one. It would be interesting to see if this had any effect on the overall comparison between RAP and HMA, but as the data was unavailable at the time of this writing, it has been neglected.
• Data is needed for the average travel distance for RAP from its waste site to the HMA plant where the RAP is being re-used. Some technologies reuse RAP in place, while some jobs use stockpiles of RAP taken from any number of places.
• The economic and ecologic value of in-place recycling is very compelling.
Recommendations for resource conservation include using RAP in the first place. One benefit of using RAP is the fact that it is taken out of the waste stream. As we have seen from this study, significant savings in total energy result from using RAP. Also, using rollers is necessary to the quality of the final product, but if there were any way to make the compactive effort of the roller better, the sensitivity analysis indicates that significant greenhouse gas emissions would be reduced by using the rollers less or somehow more efficiently.
- International Organization for Standardization (ISO). (2006). ISO 14044. Environmental Management — Life Cycle Assessment — Requirements and Guidelines. 1st ed. IHS.↵
- Compilation of Air Pollutant Emission Factors. Volume 1: Stationary Point and Area Sources. AP-42 Fifth Edition, Volume 1. Retrieved from http://www.epa.gov/ttn/chief/ap42/↵
- The Computational Structure of Life Cycle Assessment: Eco-efficiency in industry and science. v. 11. Dordrecht: Kluwer Academic.↵
- Classroom slides for ME 515. Retrieved from http://faculty.washington.edu/cooperjs/Education/ME599JC/ME599%20LCA%20Class.htm↵
- Life Cycle Assessment of Portland Cement Concrete Interstate Highway Rehabilitation and Replacement. A thesis submitted to the Graduate Faculty of the University of Washington.↵