Coarse Aggregate Angularity
Reviewed by licensed engineers
Checked against its sources by licensed professional engineers on the previous site, where reviewers weren’t recorded by name.
On this page · 5 sections
Overview
The coarse aggregate angularity (CAA) test is a method of determining the angularity of coarse aggregate (Figure 1). Coarse aggregate angularity is important to ensure adequate aggregate interlock and prevent excessive HMA deformation under load (rutting).

The CAA test estimates coarse aggregate angularity by visually inspecting a small sample of coarse aggregate and separating the sample into those pieces with a fractured face and those without (Figure 2). If more than one fractured face is specified, the same test can be done using two fractured faces as the decision criteria.
This test is used to help ensure that the resulting HMA mixture will be resistant to deformation under repeated loads. Specifying a minimum percentage of coarse aggregate angularity can also be used to obtain improved durability for aggregates used in surface treatments and to obtain increased friction and texture for aggregates used in pavement surface courses.
The standard coarse aggregate angularity tests are:
- AASHTO TP 61: Determining the Percentage of Fracture in Coarse Aggregate
- ASTM D 5821: Determining the Percentage of Fractured Particles in Coarse Aggregate

Background
The CAA test determines by visual inspection the amount (as a percent by weight) of coarse aggregate particles having fractured faces (Figure 3). The percentage of particles having fractured faces is then compared to the specification requirements. The fractured face of each rock particle must meet a minimum cross-sectional area requirement in order to be counted. Specifications typically contain requirements for percentage of fractured aggregate particles in order to maximize shear strength in either bound (e.g., HMA) or unbound aggregate mixtures. This method can be used to determine the acceptability of dense-graded, gap-graded and open-graded aggregates. This procedure is primarily conducted on aggregates for use in HMA production.

Origins
Prior to the development of Superpave, several studies indicated that HMA mixtures provided increased resistance to permanent deformation with increasing amounts of fractured faces in their coarse aggregate constituent. The Federal Highway Administration (FHWA) Office of Technology Applications recommended Pennsylvania Department of Transportation Test Method 621 as a way to measure this quality. The ASTM D 5821 method is based on the Pennsylvania Test Method and was later adopted as the method for measuring coarse aggregate angularity within Superpave mix design.
Alternate CAA Tests
It is difficult to completely describe aggregate particle shape and its contribution to HMA performance by looking just at the percentage of fractured faces. Several alternate procedures have been developed that attempt to improve upon a simple quantification of fractured faces. NCHRP Report 555, Test Methods for Characterizing Aggregate Shape, Texture, and Angularity, compared different test methods for evaluating aggregate characteristics (Masad et al., 20071).
Uncompacted Void Content
This procedure is almost identical to the FAA uncompacted void content procedure. It takes a sample of coarse aggregate and drops it into a cylinder of measured volume (Figure 4 and Video 1). Base on the weight of the aggregate in the cylinder and a known aggregate specific gravity, the volume of voids as a percentage of total volume can be calculated. As with the FAA test, this loose uncompacted void content is indicative of the relative angularity and surface texture of the sample. The higher the void content, the higher the assumed angularity and rougher the surface.

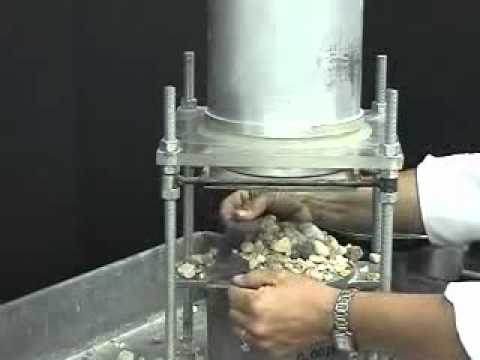
The standard coarse aggregate angularity test using loose uncompacted void content is:
- AASHTO TP 56: Uncompacted Void Content of Coarse Aggregate (As influenced by Particle Shape, Surface Texture, and Grading)
Video (Figure 5 and Figure 6)
Several research efforts are aimed at using video technology along with digital image processing to more accurately characterize aggregate angularity, surface texture and shape (Masad and Button, 20002; Masad et al., 20003; Fletcher et al., 20034; and Rao et al., 20035). These efforts have proved quite successful, however reliable standard laboratory tests are still under development. It is unknown whether or not the additional expense of digital video and computer processing will prove cost-effective as a replacement for a more simple test like coarse aggregate angularity.


Test Description
The following is a brief summary of the ASTM test. It is not a complete procedure and should not be used to perform the test. The complete test procedure can be found in:
- ASTM D 5821: Determining the Percentage of Fractured Particles in Coarse Aggregate
Summary
An aggregate sample is selected, dried, and then the coarse part of the sample is selected by sieving over an appropriate sieve. The retained coarse sample is washed to remove any remaining fine material and then dried. Each aggregate particle is then individually inspected for the specified number of fractured faces. The mass (or count) of coarse aggregate particles meeting the fractured face specification is compared to the total coarse aggregate sample mass (or particle count) and converted to a percentage.
Approximate Test Time
30 minutes.
If particle mass rather than particle count is to be used, sample preparation will take at least 12 hours or overnight because the aggregate needs to be oven dry after the washing procedure used to remove fine material.
Basic Procedure
- Prepare the aggregate sample by air-drying it so that there is clean separation of particles.
- Wash the sample over a sieve chosen to retain an appropriate coarse particle size. Typically, the No. 4 (4.75 mm) sieve (Figure 7) is chosen although others may be specified. The material retained on the sieve is then used as the test sample. The test sample should be large enough that the largest particle is no more than 1 percent of the test sample mass or the minimum test sample size should be as indicated in Table 1, whichever is smaller.

| Nominal Maximum Aggregate Size | Minimum Sample Mass, g | |
|---|---|---|
| U.S. | Metric | |
| 3.5 inches | 90.0 mm | 90000 |
| 3.0 inches | 75.0 mm | 60000 |
| 2.5 inches | 63.0 mm | 30000 |
| 2.0 inches | 50.0 mm | 15000 |
| 1.5 inches | 37.5 mm | 7500 |
| 1.0 inch | 25.0 mm | 3000 |
| 0.75 inches | 19.0 mm | 1500 |
| 0.5 inches | 12.5 mm | 500 |
| 0.375 inches | 9.5 mm | 200 |
- Dry the test sample.
- Determine the mass of the test sample.
- Spread the test sample on a clean flat surface for careful inspection and evaluation.
- Inspect each aggregate particle for the specified number of fractured surfaces. When viewing a particle, hold it so that its face is viewed directly. If the projected area of the fractured portion of the face is at least one quarter of the maximum cross-sectional area of the rock particle, consider it as a fractured face. See Figure 8 for a visualization of this projected area idea.
- Separate the particles into two categories:
- *PASS (has the required number of fractured faces).
- *FAIL (does not have the required number of fractured faces).
Note: If the required number of fractured faces is not specified, make the determination on the basis of a minimum of one fractured face.
- Determine the mass or count of particles in the PASS category and the mass or count of the particles in the FAIL category.
Note: Use mass to calculate percent fractured particles unless percentage by particle count is specified.
Results
Parameters Measured
Percentage of particles (by mass or count) that meet the specified fractured face criteria.
Specifications
Minimum CAA requirements as expressed by fractured face percentage range between about 50 percent to 100 percent. The number of fractured faces is usually specified as one or two per aggregate particle. Many agencies have their own CAA requirements, which can differ from AASHTO M 323 Superpave mix design specifications.
| Material | Value | Specification | HMA Distress of Concern |
|---|---|---|---|
| Coarse aggregate | Flat & elongated particle fraction | See Table 3 | Compaction, rutting, shoving |
| 20-yr ESALs1 (millions) | Depth from Surface² | |
|---|---|---|
| ≤ 100 mm (4 inches) | > 100 mm (4 inches) | |
| Less than 0.3 | 55/- | -/- |
| 0.3 to < 3 | 75/- | 50/- |
| 3 to < 10 | 85/80 | 60/- |
| 10 to < 30 | 95/90 | 80/75 |
| ≥30 | 100/100 | 100/100 |
Note 1 Requirements are based on the expected loading in the design lane for a 20-year period regardless of the anticipated design life.
Note 2 The first number is a minimum requirement for one or more fractured faces and the second number is a minimum requirement for two or more fractured faces.
Typical Values
CAA angularity as measured by fractured face percentage can range from 0 percent (e.g., smooth river rock) to 100 percent (e.g., some mechanically crushed rock). Many specifications use minimum CAA values between 80 and 100.
Calculations (See Interactive Equation)
Calculate the percentage of particles with the specified number of fractured faces using the following equation:
Where:
- P = percentage of particles with the specified number of fractured faces
- F = mass or count of particles with at least the specified number of fractured faces
- N = mass or count of particles not having the specified number of fractured faces
Coarse aggregate angularity (fractured faces)
Teaching this? Figures and worked examples are free to use with credit. Course reading lists
Cite this page
APA
Pavement Interactive. (2026, November 1). Coarse aggregate angularity. HeadLight. Retrieved [the date you read it], from https://pavementinteractive.org/reference-desk/testing/aggregate-tests/coarse-aggregate-angularity/
ASCE
Pavement Interactive. (2026). “Coarse Aggregate Angularity.” HeadLight, <https://pavementinteractive.org/reference-desk/testing/aggregate-tests/coarse-aggregate-angularity/> ([the date you read it]).
BibTeX
@misc{pavint-coarse-aggregate-angularity,
  author = {{Pavement Interactive}},
  title = {Coarse Aggregate Angularity},
  year = {2026},
  publisher = {HeadLight},
  howpublished = {\url{https://pavementinteractive.org/reference-desk/testing/aggregate-tests/coarse-aggregate-angularity/}},
  note = {Accessed [date]}
}Sources (5)
- Masad, E.; Al-Rousan, T.; Button, J.; Little, D. and Tutmuluer, E. (2007). NCHRP Report 555, Test Methods for Characterizing Aggregate Shape, Texture, and Angularity. Transportation Research Board, National Research Council. Washington, D.C. onlinepubs.trb.org/onlinepubs/nchrp/nchrp_rpt_555.pdf ↩
- Masad, E and Button, J.W. (2000). Unified imaging approach for measuring aggregate angularity and texture. Computer-Aided Civil and Infrastructure Engineering, v 15, n 4. pp. 273-280. ↩
- Masad, E.; Button, J.W. and Papagiannakis, T. (2000). Fine-aggregate angularity: Automated image analysis approach. Transportation Research Record 1721. Transportation Research Board, National Research Council, Washington, D.C. pp. 66-72. ↩
- Fletcher, T; Chandan, C.; Masad, E and Sivakumar, K. (2003). Aggregate Imaging System for Characterizing the Shape of Fine and Coarse Aggregates. Transportation Research Record 1832. Transportation Research Board, National Research Council, Washington, D.C. pp. 67-77. ↩
- Rao, C.; Pan, T. and Tutmuluer, E. (2003). Determination of Coarse Aggregate Surface Texture Using Image Analysis. Proceedings, 16th ASCE Engineering Mechanics Conference, July 16-18, 2003, University of Washington. ↩